by: Catherine Schmitt
All photos by Catherine Schmitt, used with permission
March 23, 2026
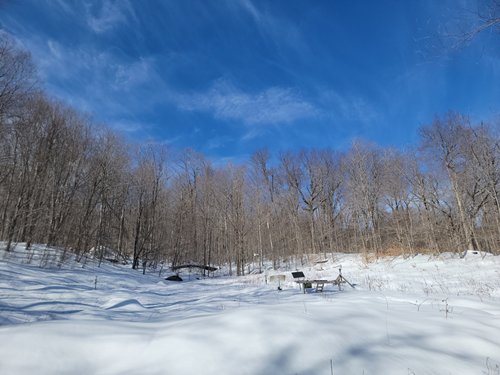
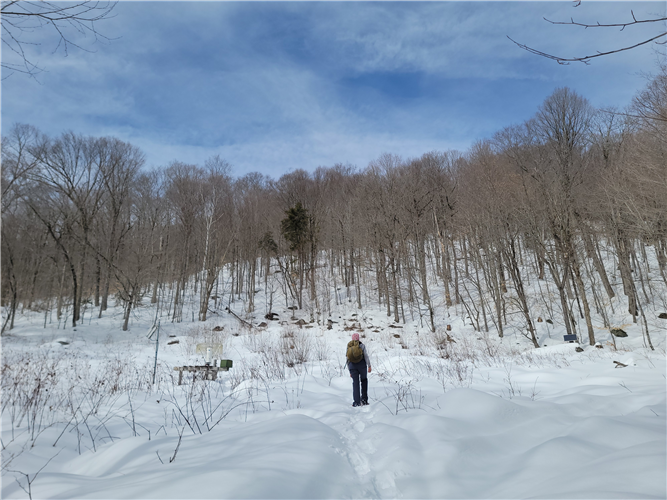
It is a late afternoon in March in the White Mountains. The last skiers are descending in the dusk as the snow begins to fall.
The snow – wet and sticky snow of almost-spring – falls on the high peaks, ridges that separate watersheds.
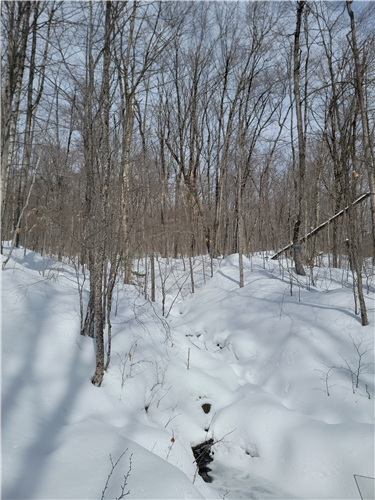
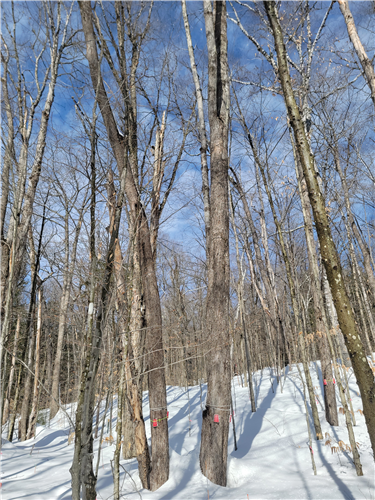
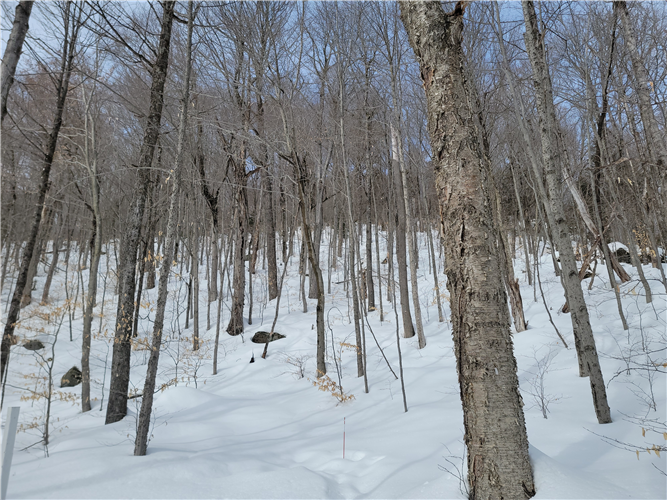
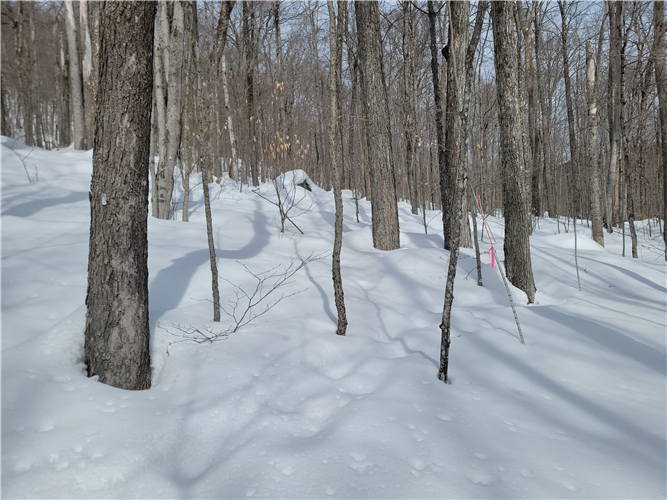
In one valley, snow is caught by branches of spruce and fir trees that grow on colder, north-facing slopes, steep and rolling terrain mostly covered in maple, ash, yellow birch, and beech.
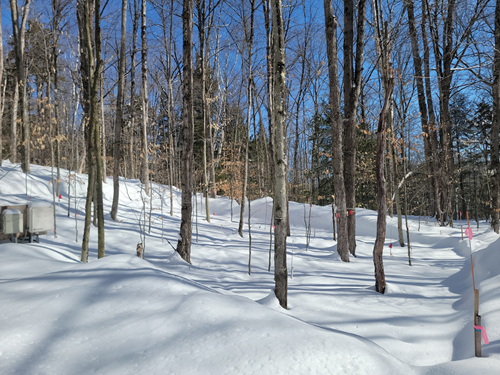
Throughout the woods, radar devices affixed to poles confirm that, based on temperature of the air (just below freezing) and the size and speed of the falling particles, it is indeed snow falling and not hail or sleet or rain.
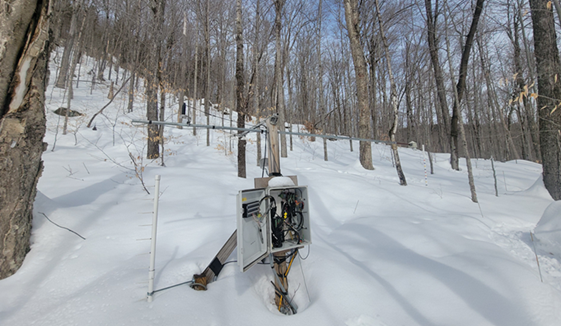
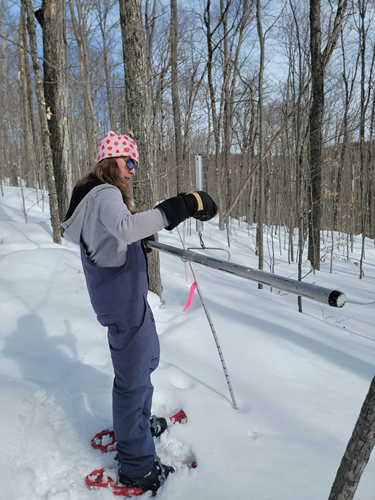
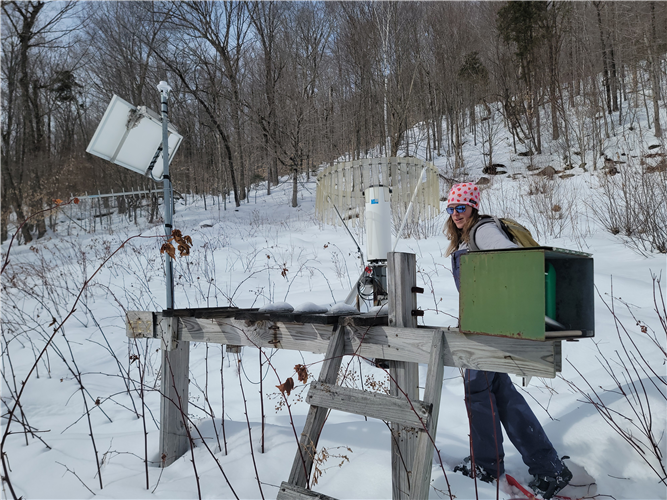
Snow settles on four giant scales that record the weight of the snowpack, while sensors overhead detect from the reflection of sound waves how deep it is. Data loggers collect these measurements every fifteen minutes and send them to a radio tower network connected to a receiver in the Robert S. Pierce Ecosystem Laboratory, U.S. Forest Service headquarters of the Hubbard Brook Experimental Forest.
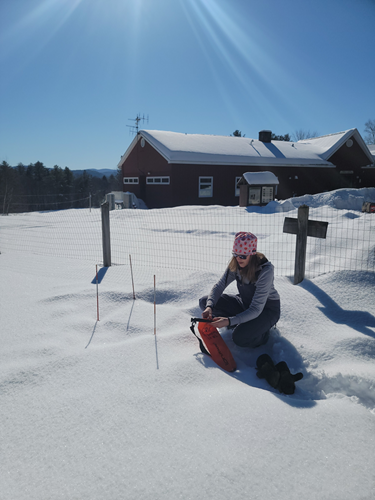
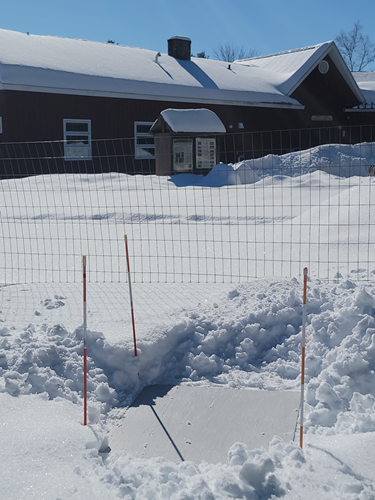
Outside of the building, snow collects on a flat wooden board, the corners marked with stakes. Wet clumps settle on the surface, a square of white in a larger plain of white. More than four inches have fallen by the time the snow stops and dawn arrives to a clear blue sky.
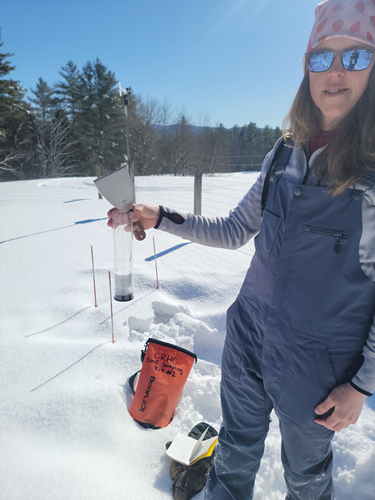
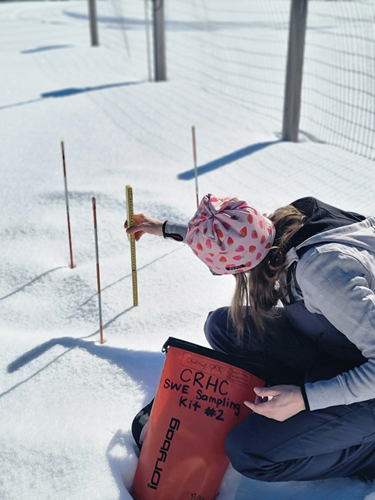
A few hours later, Hannah Vollmer, still gripping a mug of tea, picks up a bag of equipment and goes out to the board to measure the snow, first with a ruler (15 centimeters/5.9 inches) then with a clear tube pushed down through the snow to the board and weighed (23.6 grams/ 0.83 ounces), which will later be convert to snow water equivalent (SWE). Vollmer clears the snow off the board so it is ready for the next storm. The surrounding snow is already melting beneath the sun. The day is warming quickly, a welcome relief after a frigid season. Hannah, field operations manager with the Hubbard Brook Research Foundation, will have a sunburn before her day is done.
The USDA Forest Service established the Hubbard Brook Experimental Forest in 1955 to study interactions between forests and water, in particular how logging practices influenced river flows and flooding in downstream communities. Within the 12-square-mile Hubbard Brook watershed, underlain by impermeable granite, the Forest Service team outlined the boundaries of smaller tributary watersheds. They installed precipitation gauges at the highest points, over 3,000 feet above sea level, and throughout the forest to measure water coming in, and stream gauges at the low points, still some 700 feet above sea level, to measure water coming out.
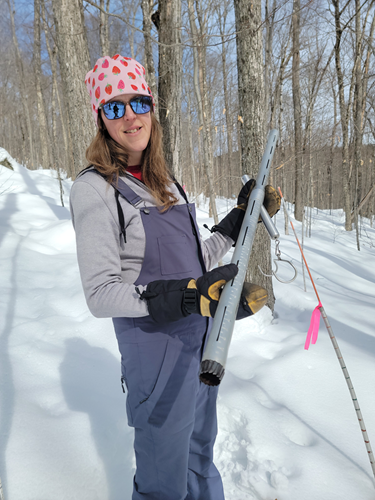
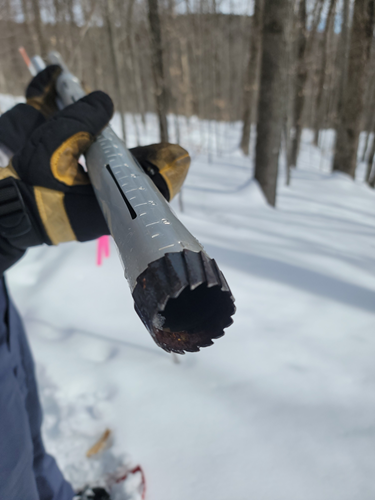
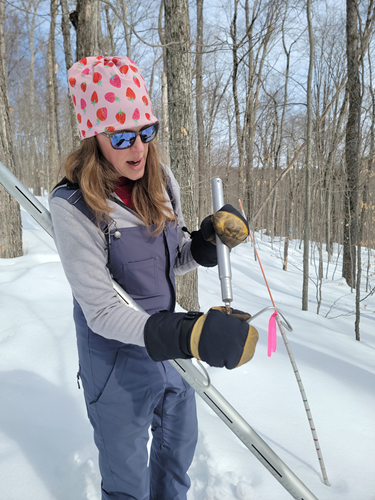
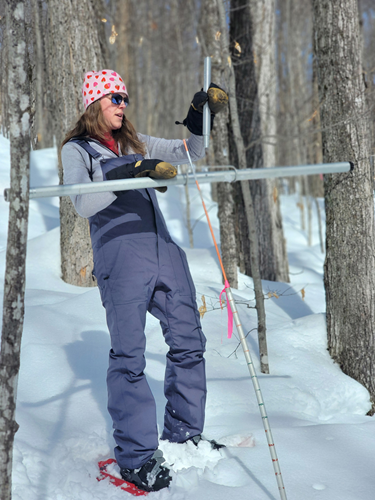
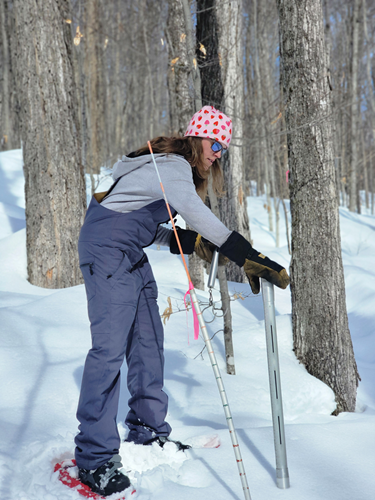
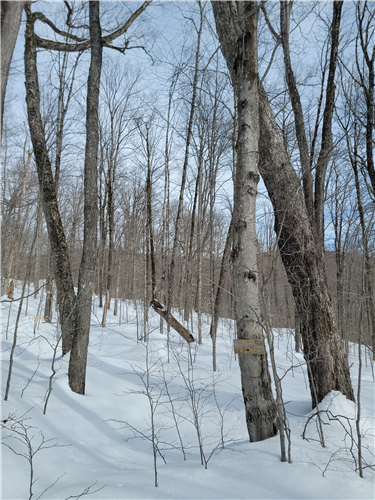
They included snow as part of the water input, because they knew winter’s snowpack was linked to the timing and magnitude of peak flows in spring, and the water that would be available the rest of the year. They first measured snow in December 1955, coring down with a metal tube until they reached the forest floor, recording the depth. Next, they suspended the tube from a hand-held scale calibrated to convert the weight of snow crystals to water content. They did this again six feet away another nine times, a line of measurements known as a “snow course.” Averaged together, the measurements showed an inch of snow on the ground. It was the beginning of winter, and the beginning of one of the longest datasets of snow in the Northeast.
By surveying the watersheds and beginning records of precipitation, water flow, soils, and vegetation, the Forest Service established a baseline that other researchers could build upon. In 1963, cooperating scientists from Dartmouth began analyzing water chemistry, and immediately realized something was wrong. Their “discovery” of acid rain would lead to decades of research on how air pollution damaged forests and lakes, and what could be done to fix it. Since then, thousands of scientists and students have participated in the Hubbard Brook Ecosystem Study, conducting hundreds of research projects that have shown the many connections among air, land, wildlife, and water.
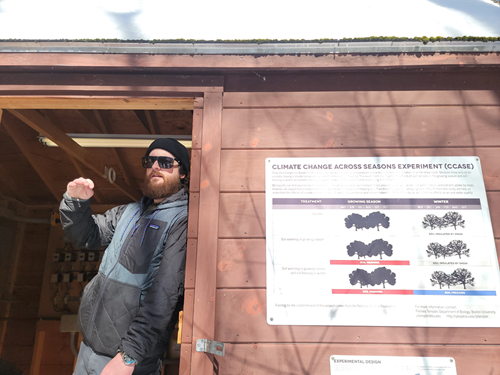
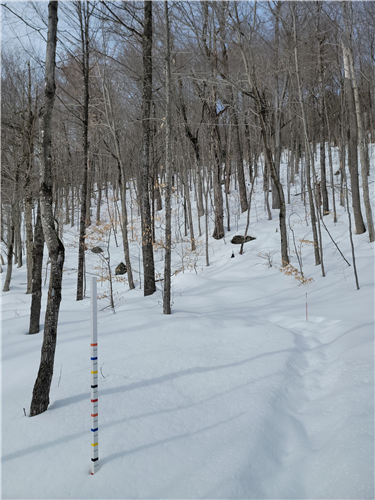
Today, the snow that falls in the Hubbard Brook valley collects in buckets of the National Atmospheric Deposition Program, set up by the New Hampshire Agricultural Experiment Station in 1978 and now coordinated by University of Wisconsin. Snow covers the ground where the Army Corps of Engineers estimates percent cover of snow and takes its own depth measurements to inform water flow management at the Franklin Falls Dam. Snow falls at sites where, from 2002 until 2021, snow and frost measurements were made by the USDA Natural Resource Conservation Service Soil Climate Analysis Network. Snow falls on another rectangle of forest, soon to melt away because cables beneath the surface keep the soil five degrees warmer, part of the Climate Change Across Seasons Experiment initiated in 2012 by researchers at Boston University. Snow piles up against a stake, to be photographed every hour by a camera attached to a tree and tethered to computers at University of New Hampshire.
Hannah Vollmer began working at Hubbard Brook in 2016, when the number of precipitation sampling sites was reduced to save costs, and automated data collection was introduced. In the years since, with a pause to earn a master’s degree and raise a family, Hannah helped to dial in the automated equipment, to figure out “how to make it work a little smoother.” The radio signaling network means staff no longer have to hike up to each sensor with a laptop to download data; the cameras and sensors mean that even the briefest of snowstorms is documented.
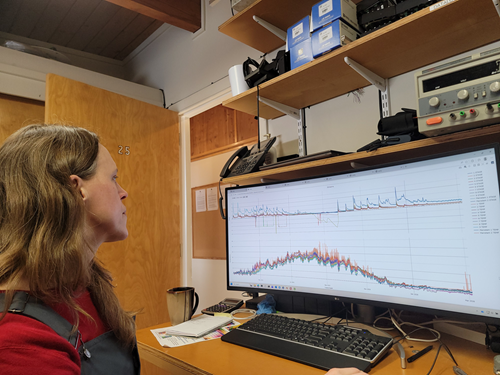
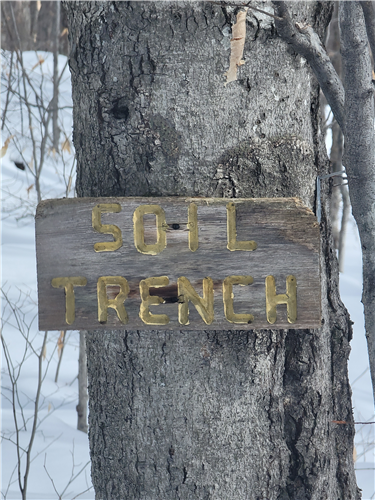
Still, human bodies and minds are needed. Frost depth is still measured by digging hands into the soil. And the snow course still needs a human to walk the line and core the snow. After the snow board measurement, which she will send to UNH scientists, Vollmer went to check on the original snow course site.
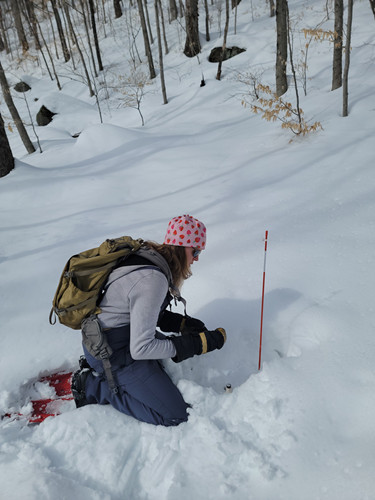
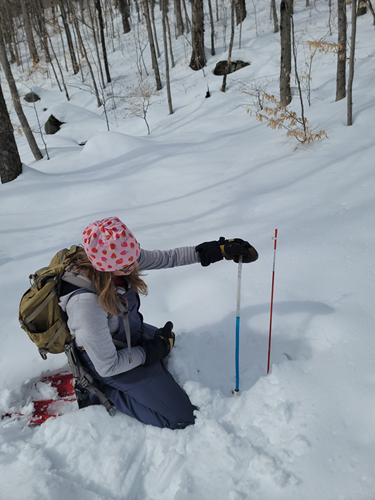
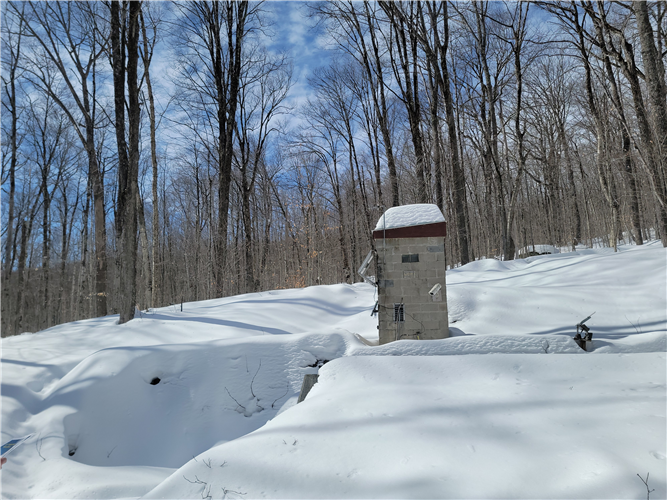
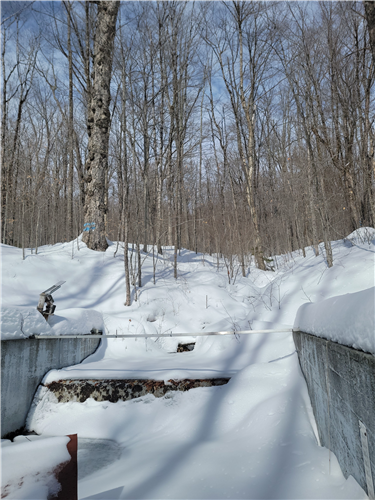
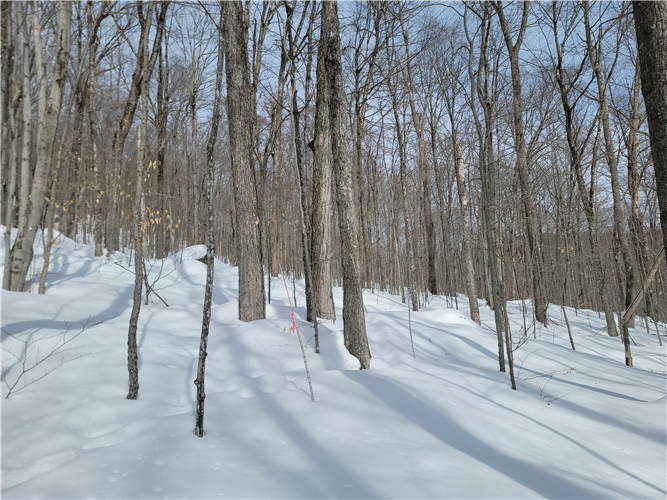
With the same snow-tube-and-scale system, Vollmer measured 30 inches of snow depth in the woods, with a density equivalent to a water depth of 7 inches. Forest Service technician Amey Bailey would be back the following Monday to complete the weekly monitoring. By then, given the forecast for a warmup, some of the snow will have already seeped into the soil; the rest will flow downhill and into the stream, to be measured again as it flows over the concrete weir constructed in the 1950s, and into Hubbard Brook and then the Pemigewasset, the Merrimack, and eventually the Atlantic Ocean.
Today, snowpack measurement remains crucial to flood forecasting. It has also proved to be a sentinel of changes in the atmosphere. According to a recent analysis of long-term snow data from Hubbard Brook, led by Geoff Wilson of the Cary Institute of Ecosystem Studies, days of snow cover, snow depth, and the amount of water held in the snowpack all have declined significantly. The snow still falls, but in this warming world, the snow melts faster, the spring thaw comes earlier.
“In some years, snow accumulates and melts, and the ground freezes and thaws faster than can be measured with our hands,” said study co-author Alix Contosta, a Hubbard Brook researcher and professor at the University of New Hampshire. “Automation helps us build a record that keeps pace with how fast winters are changing.”
Data from Hubbard Brook and other sites in the National Science Foundation-funded Long Term Ecological Research (LTER) Network tell a story of declining snowfall and a disappearing snowpack. But the data have also shown that trends can be reversed – the rain is less acidic, the forests and streams less polluted. There is a future where the snow that falls in the Hubbard Brook valley is measured by sensors in a coordinated region-wide network, sensors that show decreasing concentrations of carbon dioxide, decelerating rates of warming, and enough snow on the ground to weigh and measure.
All photos by Catherine Schmitt, used with permission