by: Catherine Schmitt
December 11, 2025
Danville, VT – The first snow has fallen, which means scientists with the federal government will soon be taking the season’s first snow measurements near the village here, as they have done for the past 65 years.
One of the longest-running snow monitoring sites in the Northeast is located in a ridge of rugged hills, between the White Mountains and the Green Mountains. From the highest elevations of over 2,000 feet, threads of water trickle down into bigger brooks and spring-fed creeks that flow through forests of sugar maple and cedar swamp, interrupted by dairy farms and cornfields.
In the 1950s, the patchwork landscape and its branching tributaries seemed to the U.S. Department of Agriculture to be an ideal setting for studying hydrology. Agency scientists had been trying to understand water flows in an attempt to help farming communities struggling with soil erosion and flooding since the Dust Bowl of the 1930s. They had already set up experiments in Ohio, Nebraska, and Texas, in small watersheds to limit confounding factors and simplify interpretation. With the increased capacity of a newly created Agricultural Research Service, part of the post-war expansion of federal science, they hoped to gain a fuller understanding of what influenced stream flows.
Vermont Governor George Aiken championed the project for funding, in part to provide employment in the area. Local residents helped construct weirs and farmers leased their land for monitoring stations.
Snow measurements began in January, 1960. Scientists knew water stored in the snowpack was released in spring as temperatures warmed and snow melted, and that the region’s soils had plenty of capacity to soak it all up. But the rate of saturation varied across the watershed, depending on slope, exposure, and other characteristics. How much actually ended up in rivers?
USDA was soon joined by the National Weather Service, and academic researchers who conducted landmark studies showing how “new water” from rain or snowmelt combined with “old water” from below ground to fill streams, according to Jamie Shanley, who has been monitoring at Sleepers River since the U.S. Geological Survey took over operations in 1991.
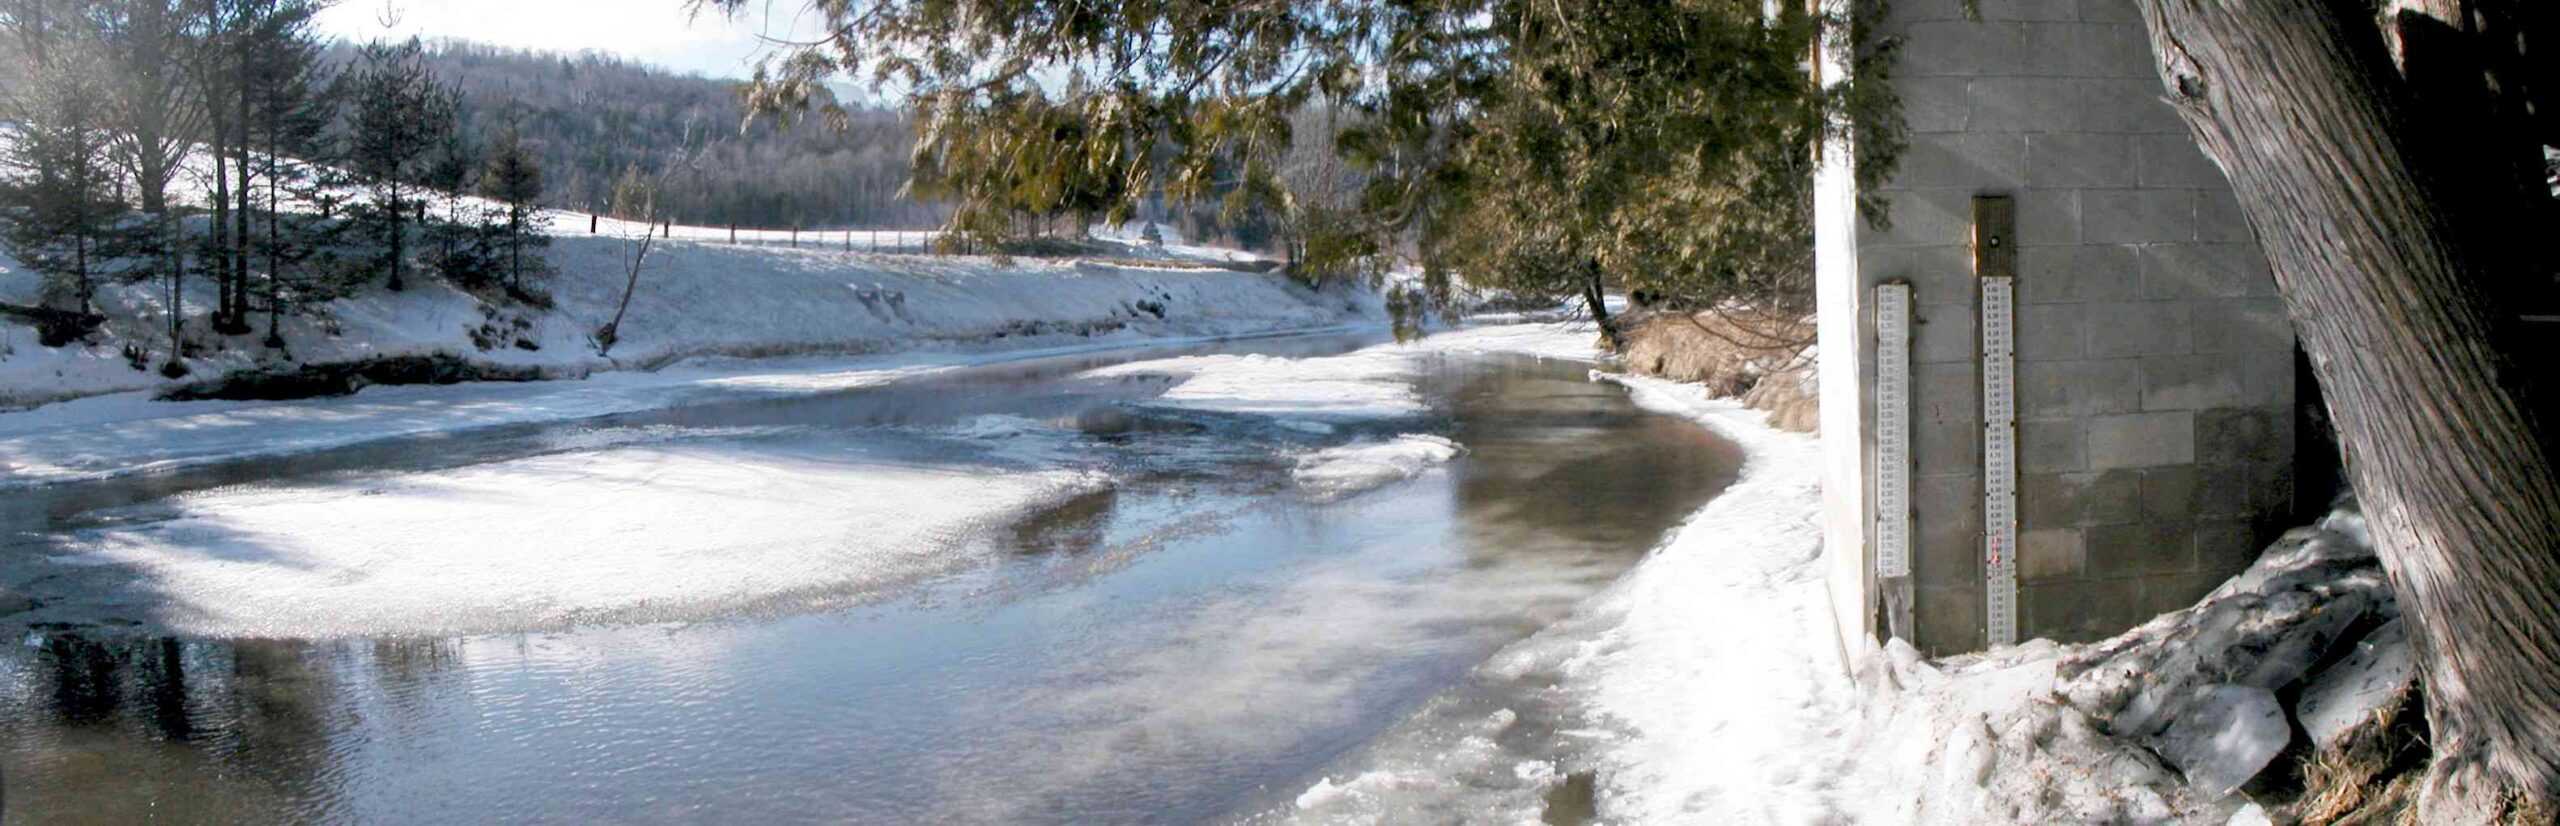
Earlier this fall, Shanley checked on the stream gauge on the Sleepers River at the base of the watershed. Water levels were low due to drought, and the river was barely dribbling over the concrete weir. “We’re not typically thought of as a place hard hit by drought, but our long-term data suggest that changes in water supply are occurring, with earlier snow melt (and earlier peak runoff in spring), and lower flows later in the summer and fall,” said Shanley, describing a “double whammy” of reduced recharge from snowmelt that sustains flows into the summer, and more frequent late summer droughts.
“All of these changes affect the function of downstream ecosystems,” said Shanley. Not far downstream, Sleepers River empties into the Passumpsic River, which flows into the Connecticut River and, ultimately, Long Island Sound.
Just as the water reflects changes in the surrounding environment, Sleepers River also mirrors changes in research priorities and federal funding over time. Watershed studies were popular in the 1980s, when scientists were focused on solving the problem of air pollution that caused acid rain. Because they wanted to study stream acidity, academic researchers tended to overlook Sleepers River, with its calcium-rich, acid-neutralizing bedrock. (Many of them went instead to Hubbard Brook, 60 miles to the southeast – more on that later!) Research funding scaled back as acid rain was largely remedied by the Clean Air Act Amendments of 1990. Instruments expired; monitoring stations were abandoned. But it turned out acid rain was not the only impact of burning fossil fuels. Scientists redirected their attention to the increased concentrations of carbon dioxide and methane that were warming the planet. The need to understand climate change “breathed new life into Sleepers River,” said Shanley. Long-term data documented change over time, while water chemistry measurements, analyzed for Sleepers River by the USDA Forest Service, helped demonstrate the role mountain forests play in the global carbon cycle that regulates climate.
In the early 1970s, researchers at Sleepers River identified that air temperature is the key determinant of snowmelt runoff, and a simple way to characterize the complicated snowmelt process. Their model is still used by the National Weather Service to predict late winter and early spring flooding and provide farmers with forecasts of the coming season’s water supply.
Today, within the USGS network, Sleepers River is one of only two small research watersheds that remain (the other is Loch Vale, Colorado). An entire building’s worth of data-recording instruments is now contained in a single data logger the size of a shoebox, but snow depth is still measured the old-fashioned way, cored with a fiberglass Adirondack snow tube tipped with aluminum teeth to twist through ice layers. Snow-water equivalent is obtained by weighing the snow core. Staying consistent with the method allows for accurate calculations of trends.

Adirondack Snow Corer. PC: https://prph2o.com/federal-snow-sampling-tubes-1/
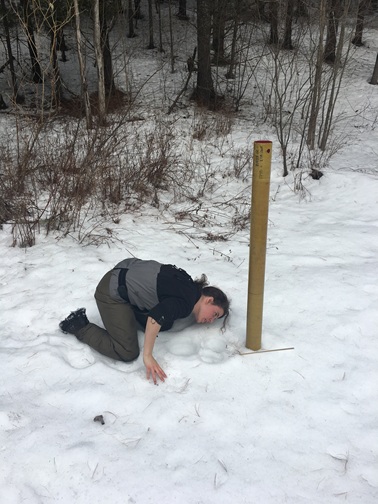
Serena Matt measuring snow depth. (PC: Jenn Fair, USGS)
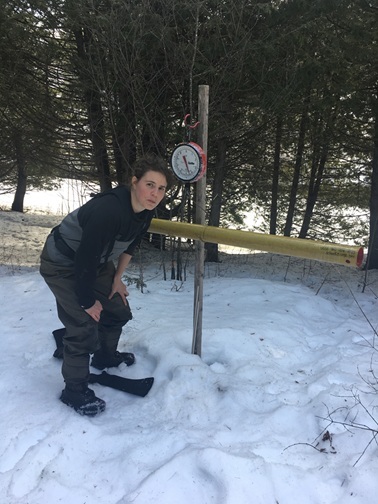
Serena Matt weighing a snow core to determine Snow Water Equivalent. (PC: Jenn Fair, USGS)
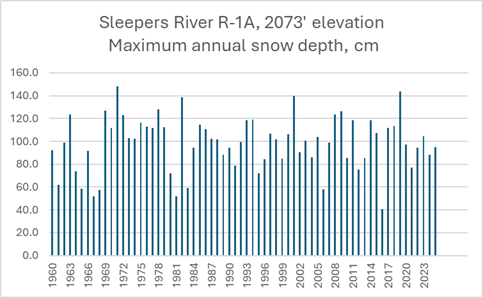
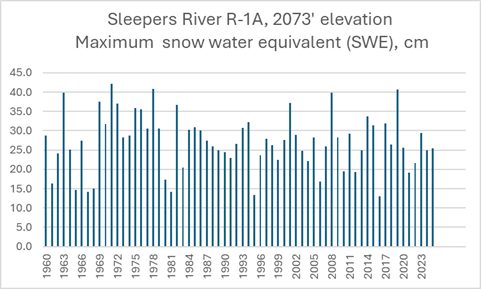
Meanwhile, new graduate students came along who saw in the long-term records of Sleepers River a foundation for further study. They set up their own equipment, the bright finish of new metal shining through the forest: a giant funnel beneath the trees collects the “throughfall” of rain and snow; a net embedded with a mesh of sensors measures the percentages of water, ice, and air in snow, providing a comparison to the snow scale and snow tube measurements, and better capturing the rain-on-snow events that are becoming more common in winter. Preliminary analysis of snow data from Sleepers River shows variability, but no long-term trend in annual maximum snow water equivalent or snow depth. The long-term data confirm recent findings that show more rapid change in southern and coastal New England than interior regions, and also demonstrate the importance of having local, site-specific information.
And what does Shanley think about a more coordinated snow monitoring system? “Snow is inherently variable, and though models are getting better, there is no substitute for a distributed network of stations that track and record snow depth across a range of elevations,” he said, noting that snow monitoring data are used to ground-truth computer models of snowpack. Information on snow conditions high up in the hills is critical to assessing the potential for spring snowmelt flooding, but with the exception of a few summit snow stakes such as Mount Mansfield, Vermont, however, snow data from higher elevations (above 1,000 feet) are scarce. This information is needed now by many people throughout the region, who are beginning to ask the question of the season, “How much snow is there?”